
In 2014 and 2015 a drug smuggle experiment has been conducted to aid the development of our R Package Psyosphere. This page gives an example how GPS sensors and Psyosphere can be used.
All participants
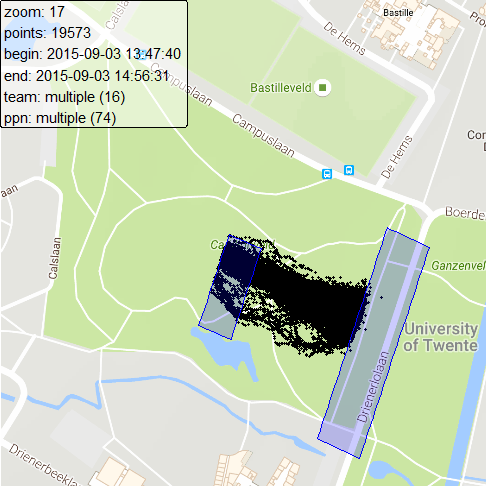
The following animation shows the movement of the participants.
The participants started a smuggle round in teams from the left. They whent up a sloop that is marked by the road in the middle. From this point forward the participants could see the border guards to the right (2, 28 and 61). Behind the border guards was a dropbox for the “drugs” and the participants walked back to the start. You can see that the participants disperse when they see the border guards. Further the sensor of guard 61 is not working properly and is drifting off. The reason is that the sensor does not have a good fix on the satellite signal. On our advice page you can read how you can reduce these malfunctions.
Flower and cocaine transportation
During the experiment students transported “flower” or “cocaine” through an area for border guards. The next animation show the behaviour of one participant. The white line shows when the participants was carrying “flower” and the black line represents “cocaine”.
Psyosphere
With Psyosphere the data is split in several rounds and can by statistically analysed.
Detailed information
You can read detailed information in our Dutch publication or in the Dutch media items.
Source
Source for animation and map: Google Earth